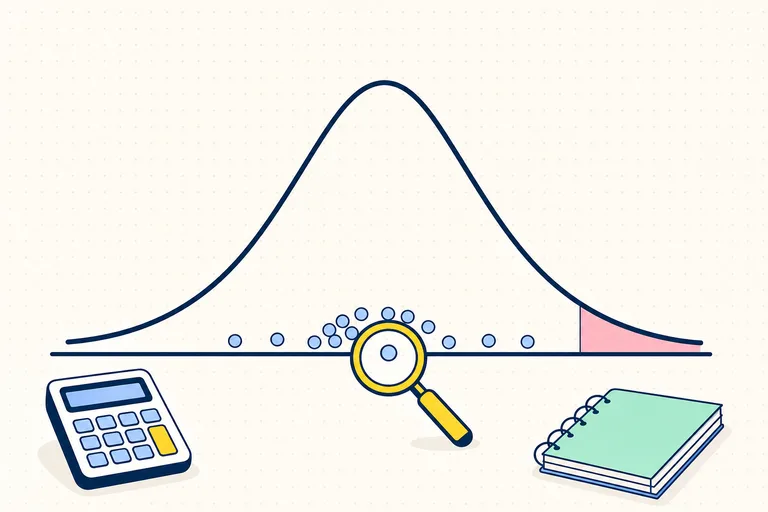
A confidence interval combines a sample estimate with a margin of error. Instead of reporting only “the sample mean is 78,” it reports a range of values that are reasonably compatible with the data and the statistical method.
The general structure is:
For a 95% confidence procedure, imagine repeating the same sampling process many times and building an interval from each sample. About 95% of those intervals would contain the true population parameter. This repeated-sampling interpretation matches the definition in the NIST/SEMATECH statistics handbook.
What a 95% confidence interval means
Suppose a sample produces a 95% confidence interval from to for a population mean.
A careful conclusion is:
We are 95% confident that the interval from 74.1 to 81.9 contains the true population mean.
The 95% describes the long-run success rate of the procedure, not a changing population mean. In the frequentist framework, the true mean is fixed. Once this particular interval has been calculated, it either contains the true mean or it does not; the method is what has 95% coverage over repeated samples.
The interval also does not mean that 95% of individual observations lie between the endpoints. A confidence interval estimates a population parameter, such as a mean or proportion. It is not a range for the raw data.
The three pieces of every interval
- Point estimate: the sample statistic, such as or .
- Standard error: the expected sample-to-sample variability of that statistic.
- Critical value: the multiplier chosen for the confidence level and sampling distribution.
The margin of error is:
A wider interval expresses less precision. A narrower interval expresses more precision, provided the model and sampling assumptions are appropriate.
Which confidence-interval formula should you use?
| Parameter and information | Introductory formula |
|---|---|
| Mean, population standard deviation known | |
| Mean, population standard deviation unknown | |
| Population proportion |
For 95% confidence with a standard normal model, . A t interval uses a critical value based on the degrees of freedom, usually for a one-sample mean.
These textbook formulas rely on conditions. The observations should come from a suitable random or representative process and be independent. For a small-sample mean, the population should be reasonably normal or the data should show no strong skew or extreme outliers. For the basic proportion interval, expected successes and failures must be large enough for the normal approximation.
Worked example 1: mean with known population standard deviation
Problem: A standardized process has population standard deviation . A random sample of scores has mean . Find a 95% confidence interval for the population mean.
Step 1: calculate the standard error
Step 2: calculate the margin of error
Step 3: build the interval
Answer: The 95% confidence interval is .
Interpretation: We are 95% confident that this interval contains the true population mean score. The statement is about the population mean, not about 95% of individual scores.
Worked example 2: mean when sigma is unknown
Problem: A sample of rechargeable batteries has mean life hours and sample standard deviation hours. Assume the data are suitable for a t procedure. Find a 95% confidence interval for the population mean battery life.
Because the population standard deviation is unknown, use a t interval. The degrees of freedom are:
For 95% confidence and , .
Step 1: calculate the standard error
Step 2: calculate the margin of error
Step 3: build the interval
Rounded sensibly, the interval is hours.
Using here would make the interval slightly too narrow because it would ignore the extra uncertainty from estimating with the sample standard deviation.
Worked example 3: confidence interval for a proportion
Problem: In a random sample of students, say they prefer digital notes. Find an approximate 95% confidence interval for the population proportion.
The sample proportion is:
The standard error is:
The margin of error is:
Build the interval:
Answer: The approximate 95% confidence interval is 55.2% to 64.8%.
Interpretation: We are 95% confident that the interval from 55.2% to 64.8% contains the population proportion of students who prefer digital notes.
The sample contains successes and failures, so the normal-approximation counts are comfortably large for this introductory calculation.
What makes an interval wider or narrower?
| Change | Effect on interval width | Reason |
|---|---|---|
| Larger sample size | Narrower | standard error falls with |
| Higher confidence level | Wider | larger critical value is required |
| More variable data | Wider | standard error increases |
| Lower confidence level | Narrower | smaller critical value is used |
Quadrupling the sample size roughly halves the standard error because . Doubling the sample size does not halve the margin of error.
A larger sample improves precision, but it does not fix biased sampling. A very narrow interval from a systematically unrepresentative sample can still miss the population value for reasons the formula does not capture.
Confidence intervals and hypothesis tests
For a two-sided hypothesis test at , a matching 95% confidence interval leads to the same decision under the same assumptions:
- if the null value lies outside the interval, reject the null hypothesis;
- if the null value lies inside the interval, fail to reject the null hypothesis.
The interval is more informative than a yes-or-no decision because it shows the estimated effect and its precision. See the complete hypothesis testing steps for the parallel testing workflow.
The NIST confidence-interval approach likewise explains the link between whether a 95% interval contains the null value and the corresponding 5% hypothesis-test decision.
Common confidence-interval mistakes
Saying “95% of the data are in the interval”
The interval estimates a parameter. It does not describe where individual observations fall.
Saying “there is a 95% chance the true value is here”
In the standard frequentist interpretation, the parameter is fixed and the interval-producing procedure is random. State confidence in the procedure’s coverage rather than assigning probability to the fixed parameter after calculation.
Using z when sigma is unknown
For a mean with unknown population standard deviation, an introductory one-sample interval generally uses the t distribution and the sample standard deviation .
Mixing standard deviation and standard error
Standard deviation describes spread among individual observations. Standard error describes how much a sample statistic varies across repeated samples. Review the distinction in our standard deviation guide.
Ignoring study design
The formula measures sampling variability under its assumptions. It does not automatically account for nonresponse, convenience sampling, measurement bias or dependence.
Rounding before the endpoints
Keep several decimal places for the standard error and critical value. Round the final lower and upper endpoints to a precision appropriate for the original data.
A confidence-interval reporting template
Use this sentence structure:
Based on [sample and method], the [confidence level] confidence interval for [population parameter in context] is ([lower], [upper]). We are [confidence level] confident that this interval contains the true [population parameter].
Then add a condition or limitation when it matters: “This conclusion assumes the sample is representative and the observations are independent.”
For a confidence-interval question captured from a worksheet or textbook, SolveTap’s statistics problem solver can identify the parameter, choose z or t, and show the calculation. Check the conditions and interpretation before accepting the numerical endpoints.
Frequently asked questions
Is a 99% confidence interval always better than a 95% interval?
No. A 99% interval has higher long-run coverage but is wider when based on the same data. The choice trades precision for confidence and should be made before looking at the result.
Why does a larger sample make the interval narrower?
The standard error usually contains in the denominator. As grows, the estimate varies less from sample to sample, so the same confidence level needs a smaller margin of error.
What if a confidence interval includes zero?
It depends on the parameter. For a difference, zero often represents “no difference.” If a 95% interval for a difference includes zero, the matching two-sided test generally fails to reject a zero difference at the 5% level under the same assumptions.
Can a confidence interval be wrong?
Yes. A particular interval can miss the true parameter, and poor sampling or violated assumptions can make the advertised coverage unreliable. Confidence intervals quantify uncertainty from the model and sampling process; they do not guarantee an unbiased study.