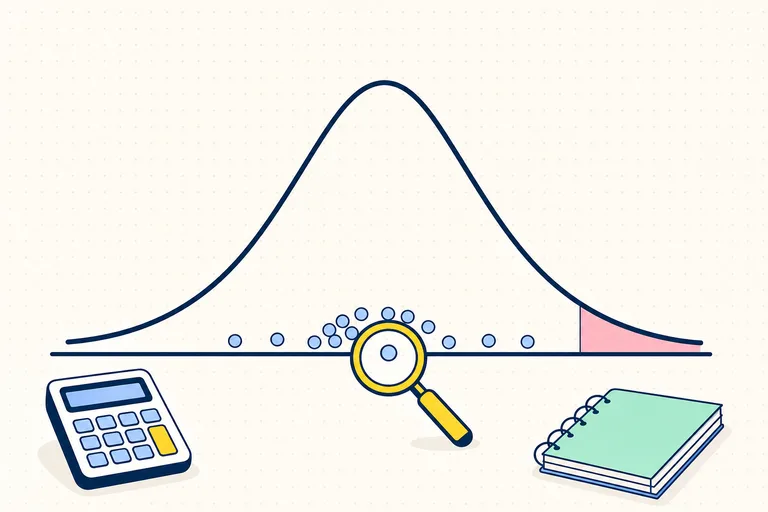
A hypothesis test asks whether sample evidence is surprising enough to challenge a claim about a population. It does not prove a hypothesis with certainty. Instead, it measures how compatible the observed data are with a precisely stated null hypothesis.
Most introductory tests follow the same five-step structure:
- State the null and alternative hypotheses.
- Choose a significance level and check conditions.
- Calculate the test statistic.
- Find the p-value.
- Make a decision and write the conclusion in context.
Core idea: the p-value is the probability, assuming the null hypothesis is true, of obtaining a result at least as extreme as the one observed.
Step 1: state the null and alternative hypotheses
The null hypothesis, written , describes the baseline claim. It contains equality:
The alternative hypothesis, written or , describes the effect or difference the study is looking for:
- Two-sided:
- Right-tailed:
- Left-tailed:
Write hypotheses about population parameters, not sample statistics. A sample mean is evidence; the population mean is what the claim concerns.
The wording of the research question determines the alternative. “Different” means two-sided. “Greater” means right-tailed. “Less” means left-tailed. Choose the direction before looking at the sample result.
Step 2: select alpha and check conditions
The significance level, , is the threshold for deciding whether the evidence is strong enough to reject . A common choice is (0.05), but it should reflect the consequences of a false positive and be selected before analyzing the data.
Conditions depend on the procedure. A one-sample t-test for a mean typically requires:
- Data from a random sample or randomized process.
- Independent observations. When sampling without replacement, the sample should usually be no more than 10% of the population.
- A population that is approximately normal, or a sample large enough for the sampling distribution of the mean to be approximately normal. Small samples should not show strong skew or extreme outliers.
Checking conditions is part of the solution. A calculator can produce a p-value even when the test is inappropriate.
Step 3: calculate the test statistic
A test statistic measures how far the observed estimate lies from the null value in standard-error units.
For a one-sample t-test:
where is the sample mean, is the null mean, (s) is the sample standard deviation and (n) is the sample size. The degrees of freedom are .
A statistic near zero means the estimate is close to the null value. A statistic far into a tail means the estimate would be unusual if were true.
Step 4: find the p-value
The p-value is a tail area under the reference distribution:
- A right-tailed test uses the area to the right of the observed statistic.
- A left-tailed test uses the area to the left.
- A two-sided test counts equally extreme results in both directions.
The p-value is conditional on the null hypothesis and the model assumptions. It is not the probability that is true.
Step 5: decide and conclude in context
Compare the p-value with :
- If , reject .
- If , fail to reject .
Say “fail to reject,” not “accept the null.” A non-significant result means the sample did not provide strong enough evidence against ; it does not demonstrate that the null is exactly true.
Finish with a sentence about the population and the original question, not only a mechanical decision.
Worked example 1: one-sample t-test for a mean
Problem: A tutoring program claims that students complete a task in an average of (100) minutes. A random sample of (10) students has a mean time of (103) minutes and a sample standard deviation of (4.0) minutes. At , is there evidence that the population mean time differs from (100) minutes?
1. State the hypotheses
The word “differs” makes this a two-sided test:
2. Check conditions
The problem states that the sample is random. We assume (10) students are less than 10% of the relevant student population, supporting independence. Because is small, we would also inspect the raw data or a plot for severe skew and outliers before trusting the t procedure.
3. Calculate the statistic
The degrees of freedom are:
4. Find the p-value
For a two-sided t-test with and , the p-value is approximately:
5. Decide and conclude
Because , reject .
Conclusion: At the 5% significance level, the sample provides evidence that the population mean completion time differs from 100 minutes.
Statistical significance does not automatically imply a practically important difference. The observed sample mean is only 3 minutes higher, so the practical impact should be evaluated separately.
Worked example 2: a z-test with known population standard deviation
Problem: A machine is set to fill bottles with a mean of . Its long-run population standard deviation is known to be . A random sample of (36) bottles has a mean fill of . At , test whether the machine’s mean fill differs from .
1. State the hypotheses
This is two-sided because the question asks whether the setting differs in either direction.
2. Check conditions
The sample is random, (36) observations are plausibly less than 10% of production, and the sample is large enough for the sampling distribution of the mean to be approximately normal. The population standard deviation $\sigma=6$ is known, so a z-test is appropriate.
3. Calculate the statistic
4. Find the p-value
The standard normal area below (-2.00) is approximately (0.0228). Because the test is two-sided, double that tail area:
5. Decide and conclude
Because , reject .
Conclusion: At the 5% level, there is evidence that the machine’s population mean fill differs from . The sample suggests underfilling, but the two-sided test was chosen before observing that direction.
What changes in a one-tailed test?
Suppose the bottle question had specifically asked whether the machine was underfilling, with . The statistic would still be , but the p-value would use only the left tail: .
You cannot switch from two-sided to one-sided after seeing the sample because that artificially makes the result easier to call significant. The alternative must come from the original research question.
Common hypothesis-testing mistakes
Saying the p-value is the probability that the null is true
A frequent but incorrect statement is “there is a 4% chance the null is true.” The p-value assumes is true and measures how unusual the observed evidence would be under that assumption.
Accepting the null hypothesis
Failing to reject may result from a true null, a small effect, a noisy measurement or a sample too small to detect the effect. Use the more cautious phrase “fail to reject.”
Ignoring conditions
A precise-looking statistic does not repair biased sampling, dependent observations or a severely inappropriate distributional model.
Confusing significance with importance
Large samples can make tiny effects statistically significant. Report or discuss the estimated effect and a confidence interval alongside the hypothesis test.
Rounding before the final step
Retain several decimal places for standard errors and test statistics. Early rounding can move a p-value across the selected threshold.
The connection to confidence intervals
For a two-sided test at , the decision agrees with the matching 95% confidence interval: if the null value lies outside the interval, reject ; if it lies inside, fail to reject. The interval adds useful information because it shows a range of plausible effect sizes, not only a binary decision.
A reporting template
Use this structure in homework, lab reports and exams:
A [test name] was used to test : [null] against : [alternative]. The conditions were [brief check]. The result was [test statistic] with [degrees of freedom if relevant], . Because (p) [comparison] , we [reject/fail to reject] . There is [sufficient/insufficient] evidence that [conclusion about the population in context].
For a problem captured from a worksheet or learning platform, SolveTap’s statistics problem solver can identify the test, check the conditions and explain the conclusion. Always confirm that the hypotheses and tail direction match the original question.
Frequently asked questions
What does a significance level of 0.05 mean?
It is a decision threshold chosen before the analysis. In a long-run framework, a procedure that rejects a true null whenever has a 5% Type I error rate under its assumptions. It does not mean there is a 5% probability that this particular null hypothesis is true.
Is a smaller p-value always better?
A smaller p-value represents stronger incompatibility with the null model, but it says nothing by itself about effect size, practical importance, study quality or bias.
What if the p-value equals alpha exactly?
Under the standard rule , reject . Report the actual p-value when possible rather than hiding a borderline result behind only “significant” or “not significant.”
When should I use a t-test instead of a z-test?
For a population mean, use a t procedure when the population standard deviation is unknown and is estimated by the sample standard deviation. A z procedure for a mean requires a known population standard deviation, which is uncommon outside controlled processes or textbook exercises.