Standard deviation measures how far values typically lie from their mean. A small standard deviation means the data are tightly clustered; a large one means they are more spread out.
Calculating it by hand is a sequence of ordinary operations: find the mean, measure every deviation, square those deviations, add them, divide, and take a square root. The only major choice is whether the data represent a complete population or a sample.
Interpretation: standard deviation uses the same units as the original variable. If quiz scores have a standard deviation of 1.6 points, a typical score lies roughly 1.6 points from the mean—not 1.6 squared points.
The six-step process
For values :
- Calculate the mean.
- Subtract the mean from each value.
- Square every deviation.
- Add the squared deviations.
- Divide by for a population or by for a sample.
- Take the square root.
The population standard deviation is:
The sample standard deviation is:
The symbols differ because and describe a population, while and describe a sample.
Worked example 1: six quiz scores
Problem: A tutor records these quiz scores, each out of 12 points, for all six students in one small review group:
Find the population standard deviation for this group.
Step 1: calculate the mean
Add the scores and divide by the number of students:
The mean score is points.
Step 2: find each deviation
Subtract the mean from every score:
| Score | Deviation |
|---|---|
| 6 | |
| 7 | |
| 7 | |
| 8 | |
| 9 | |
| 11 |
The deviations add to zero:
That is a useful check. Deviations from the arithmetic mean should always sum to zero, apart from small rounding error.
Step 3: square the deviations
Squaring prevents negative and positive deviations from canceling:
| Score | ||
|---|---|---|
| 6 | 4 | |
| 7 | 1 | |
| 7 | 1 | |
| 8 | 0 | |
| 9 | 1 | |
| 11 | 9 |
Step 4: add the squared deviations
This total is called the sum of squares.
Step 5: divide by the population size
These six students are the complete group being described, so divide by :
This result is the population variance. Its units are squared points.
Step 6: take the square root
Answer: The group's population standard deviation is approximately points.
A score of 11 is points above the mean, farther away than the other scores, so its squared deviation of 9 contributes more than half of the total sum of squares.
Population versus sample: N or n−1?
Use the population formula when your data include every member of the group you want to describe. Use the sample formula when the observed values are a sample used to estimate variability in a larger population.
| Situation | Divide by | Symbol |
|---|---|---|
| Describing the complete population | ||
| Estimating from a sample |
If the six quiz scores were instead a sample of students used to estimate variability among all students in the course, the numerator would still be 16, but the denominator would change:
The sample standard deviation would be points. Dividing by , called Bessel's correction, compensates for the tendency of a sample's deviations from its own mean to underestimate population variability.
The choice depends on the purpose of the analysis, not merely the size of the dataset. A dataset with thousands of records can still be a sample; a dataset with six records can be the full population of interest.
Worked example 2: sample waiting times
Problem: A clinic records the waiting times, in minutes, of five randomly selected morning patients:
Use the sample to estimate the standard deviation of morning waiting times.
Find the sample mean
Build the deviation table
| Time | ||
|---|---|---|
| 3 | 4 | |
| 5 | 0 | |
| 5 | 0 | |
| 6 | 1 | |
| 6 | 1 |
The deviations sum to zero, and the squared deviations sum to:
Divide by n−1 and take the square root
Because these patients are a sample of a larger set of morning patients:
Answer: The sample standard deviation is approximately minutes.
How to interpret standard deviation
Standard deviation is a distance-like measure, but it does not promise that every observation lies within one standard deviation of the mean. Its interpretation depends on the distribution's shape.
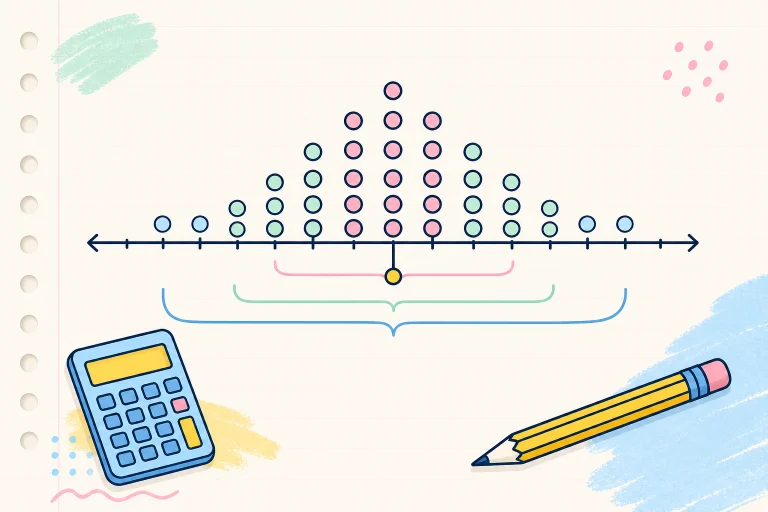
For an approximately bell-shaped distribution, the empirical rule says about 68% of values lie within one standard deviation of the mean, about 95% within two, and about 99.7% within three. Do not apply this rule automatically to strongly skewed or irregular data.
Standard deviation is also sensitive to outliers because deviations are squared. If the score 11 in the first dataset were replaced by a much larger value, both the mean and standard deviation would increase.
Common calculation mistakes
Forgetting to square negative deviations
, not . Use parentheses when entering negative values into a calculator.
Adding deviations instead of squared deviations
Raw deviations from the mean sum to zero, so they cannot measure spread directly. Square first, then add.
Taking the square root too early
Add all squared deviations and divide to find the variance. Take one square root at the end.
Choosing the denominator from habit
Read the context. “All employees in this office” suggests a population for that office; “a random selection of employees” suggests a sample.
Rounding the mean too soon
When the mean is not an integer, keep several extra digits throughout the table and round only the final standard deviation.
Reporting variance as standard deviation
Variance is the quantity before the square root and has squared units. Standard deviation returns to the original units.
SolveTap's statistics problem solver can organize a dataset and explain which formula matches the question. Standard deviation also appears in inferential procedures such as the hypothesis testing steps, where sample variability helps determine the standard error.
Frequently asked questions
Can standard deviation be negative?
No. Squared deviations are nonnegative, and the principal square root is nonnegative. A standard deviation of zero means every observation equals the mean.
What is the difference between variance and standard deviation?
Variance is the average or corrected average of squared deviations. Standard deviation is the square root of variance, so it uses the original variable's units and is usually easier to interpret.
Should I remove an outlier before calculating?
Not automatically. First check whether it is a data-entry or measurement error. A legitimate extreme value may be important information; if you report an analysis without it, explain and justify that decision.
Does a larger mean cause a larger standard deviation?
No. Adding the same constant to every observation changes the mean but leaves every deviation—and therefore the standard deviation—unchanged.
Why do calculators show σx and sx?
is the population standard deviation, which divides by . is the sample standard deviation, which divides by . Choose the output that matches the role of your data.