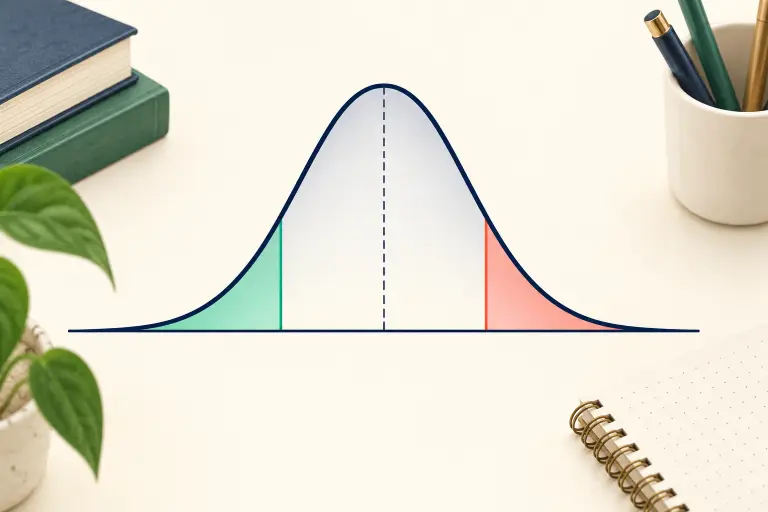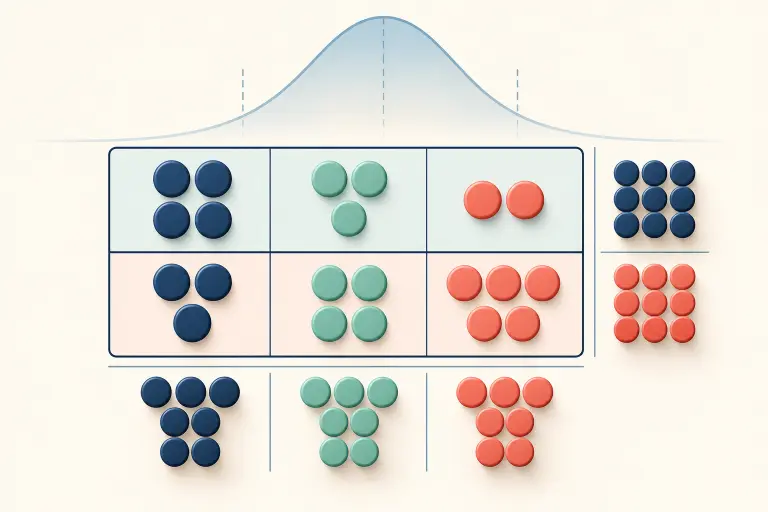
A chi-square test of independence asks whether two categorical variables are associated in a population. Put the observed counts into a two-way table, calculate the counts expected if the variables were independent, then add the contributions . A large total relative to its chi-square distribution gives evidence against independence.
This guide works through every cell of a table. It is about the test of independence, not chi-square goodness of fit or a test about a population variance. OpenStax and Penn State's STAT 500 lesson provide further course-level explanations.
The procedure at a glance
State : the two categorical variables are independent. State : they are associated.
Check that the data come from a suitable random/representative process, observations are independent, and expected cell counts are large enough for the approximation used by your course. A common conservative introductory rule is at least 5 in every expected cell.
For each cell, calculate its expected count from its row total, column total and grand total:
Compute and .
Find the right-tail p-value from the chi-square distribution with those degrees of freedom, compare it with the prespecified , and write a conclusion about association in context.
Use counts, not percentages, in the observed table. The expected counts come from the row and column margins under the independence assumption; they are not simply the average of all cells.
Worked example 1: a complete 2×3 test
Question: In a hypothetical random sample of students, is study format (solo or group) associated with a three-level preference response (A, B or C)? Suppose the observed table is:
| Study format | Response A | Response B | Response C | Row total |
|---|---|---|---|---|
| Solo | 30 | 20 | 10 | 60 |
| Group | 20 | 30 | 10 | 60 |
| Column total | 50 | 50 | 20 | 120 |
These numbers are an illustrative example, not SolveTap user research. The hypotheses are : study format and response category are independent in the population; : they are associated. Set before calculation.
Calculate every expected count
For the solo/A cell, . The group/A expected count is also . Response B has the same column total, so its two expected counts are . Response C has expected count in each row.
| Study format | Expected A | Expected B | Expected C |
|---|---|---|---|
| Solo | 25 | 25 | 10 |
| Group | 25 | 25 | 10 |
Each expected count is at least . The expected counts sum to , and each expected row/column total matches its observed margin. Those are useful arithmetic checks. In real data, also verify the sampling and independence assumptions; large expected counts do not fix biased sampling.
Calculate the chi-square statistic
| Cell | |||
|---|---|---|---|
| Solo / A | 30 | 25 | 1 |
| Solo / B | 20 | 25 | 1 |
| Solo / C | 10 | 10 | 0 |
| Group / A | 20 | 25 | 1 |
| Group / B | 30 | 25 | 1 |
| Group / C | 10 | 10 | 0 |
Add the six contributions: . There are rows and response columns, so . For a chi-square distribution with degrees of freedom, the right-tail area beyond is about .
Because , fail to reject . This sample does not provide sufficient evidence at the level of an association between study format and response category. It does not prove that the variables are independent in every population.
Worked example 2: check expected counts in a 2×2 table
Question: A different illustrative sample records yes and no responses in group A, and yes and no responses in group B. Are the counts large enough for the usual chi-square approximation?
Each group totals ; the yes column totals , the no column totals , and the grand total is . The expected counts for each row are yes and no. All four expected counts exceed , so they pass that introductory approximation check. The study still needs appropriate sampling and independent observations.
If you continue the test, . Do not confuse the table's four cells with four degrees of freedom.
Worked example 3: a table you should not test this way
Question: An illustrative table has row totals of and , column totals of and , and grand total . Can you use the usual large-sample chi-square approximation under the conservative all-cells-at-least-five rule?
The expected counts in each row are and . Two expected cells are only 1, so that rule fails. A analysis may use an exact method such as Fisher's exact test when appropriate, or require a different sampling/design approach. Combining response categories is justified only if the categories can meaningfully be combined, not simply to force a favorable result.
Interpret the result accurately
A statistically significant chi-square test suggests an association, but it does not reveal which cells drive it, how strong the association is, or whether one variable causes the other. Follow up with conditional percentages and, when useful, cell residuals and a measure of association. A nonsignificant result is a lack of sufficient evidence under this analysis, not proof of no relationship.
The hypothesis-testing guide explains the general null/alternative and p-value logic. The Statistics Solver can help you parse a word problem, while statistics resources collects related lessons. SolveTap's current z-score and confidence-interval calculators do not calculate chi-square tests.
Practice with answer
Two groups each have 30 students. Group A has 18 yes and 12 no; group B has 12 yes and 18 no. Find the expected counts and χ².
The yes and no columns each total , and the grand total is . Each expected count is . Every cell differs from expected by , so each contribution is . Therefore with . The right-tail p-value is about , so the test is not significant at under the stated assumptions.