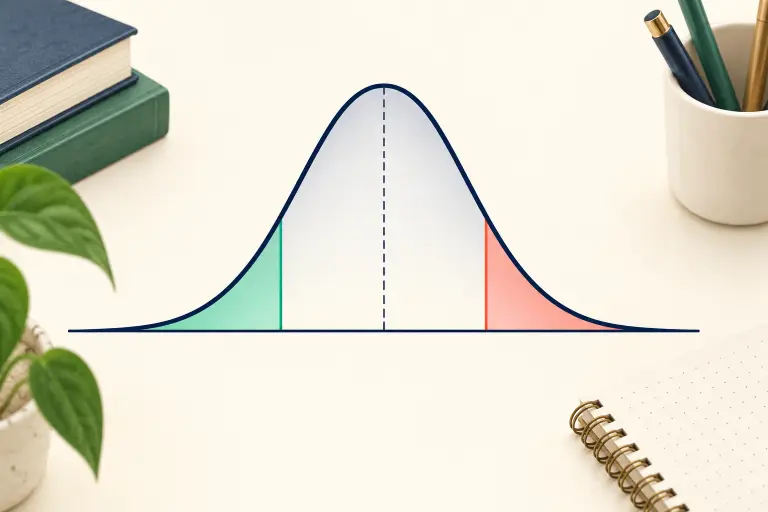
To find a p-value from a z-test statistic, choose the test's tail before looking at the result, then use the standard normal curve. If is the area to the left of , a left-tailed p-value is , a right-tailed p-value is , and a two-tailed p-value is .
For example, has . Its right-tailed p-value is ; its two-tailed p-value is about . A number called a “z-score” is not automatically a hypothesis-test result: the null hypothesis, valid test conditions and alternative direction also matter.
Choose the tail first
The alternative hypothesis tells you which outcomes count as evidence against the null. Do not choose the tail after seeing which p-value is smaller.
| Alternative | Tail area counted | P-value from a z statistic |
|---|---|---|
| “Less than” | Left of observed | |
| “Greater than” | Right of observed | |
| “Different from” | Both tails as extreme as $ | z |
Here is the cumulative distribution function for a standard normal variable . The two-sided formula is equivalent to . It accounts for equally extreme results on either side of zero.
This page focuses on converting a valid z-test statistic to a tail probability. The broader hypothesis-testing guide shows how to formulate hypotheses, check assumptions and calculate the statistic in the first place. OpenStax's hypothesis-test examples show those steps in context.
If the data are counts in categories rather than a z statistic for a mean or proportion, the relevant procedure may instead be a chi-square test of independence.
How to read a z-table
First identify what your table reports. Many classroom tables give , the area to the left. Others give the area between zero and ; those require an extra add or subtract step.
For a left-area table and , read row 1.6 and column 0.04 to obtain about 0.9495. That is . The right-tail area is . For negative scores, use the table's negative rows or symmetry: .
Continuous normal probabilities are unaffected by whether the endpoint is written or . Round the final p-value, rather than rounding early near a decision threshold.
Example 1: a right-tailed test
Problem: A preselected alternative says the population mean is greater than the null value. A valid z test gives . Find the p-value.
“Greater” means the right tail. From a left-area table, , so
Answer: . At a prespecified , this is just above the threshold, so the standard decision is fail to reject the null. That decision says nothing by itself about practical importance.
Example 2: a negative z in a left-tailed test
Problem: The alternative says the population mean is less than the null value. The z test gives .
The p-value is the left-tail area. Symmetry and a left-area table give .
Answer: About . Do not change the negative sign to positive and use as the p-value; that is almost the entire curve on the wrong side.
Example 3: a two-tailed test
Problem: The alternative says the mean is different from the null value. The z test gives .
The left area is . The area at or above is . Double that smaller tail:
Answer: . A result as far from zero in either direction is not unusual under this model. “Fail to reject” does not prove the null is true.
Quick checks that catch errors
- A p-value must be between and . If doubling a tail gives more than , you doubled the larger tail.
- For the same nonzero , a symmetric two-sided p-value is twice the smaller one-sided tail.
- At , the two-sided p-value is , because every standard-normal value is at least as far from zero as zero.
- The threshold is chosen before looking at the data. Do not change the tail or threshold to manufacture significance.
The z-score calculator can calculate a standard score from a value, mean and standard deviation. It does not return a hypothesis-test p-value or check whether a z test is appropriate. The Statistics Solver can help you examine a full word problem, but verify the tail choice and assumptions yourself. More tutorials are in statistics resources.
Practice with answers
1. z = 1.96 in a right-tailed test. What is p?
, so .
2. z = −1.28 in a left-tailed test. What is p?
.
3. z = −2.00 in a two-tailed test. What is p?
The smaller one-sided tail is , so .
Further reading: OpenStax's standard normal distribution lesson explains z areas and symmetry.